
The `netstat` command, short for “network statistics,” is a powerful tool used for monitoring network connections and traffic statistics in a system. It’s especially useful for identifying and troubleshooting TCP/IP-based connections, which are crucial for diagnosing network issues or security threats like unauthorized remote connections.
In cybersecurity, netstat is often used to detect suspicious connections or activities between a local computer and a remote one. Its flexibility in displaying detailed information on network connections, routes, and protocols makes it a go-to tool for system administrators and IT professionals.
Common Uses of Netstat
Netstat provides various options to view specific statistics and information about a system’s network activities. Some of its common uses include:
– Viewing Active Connections: Netstat allows you to list all open TCP/IP network connections.
– Analyzing Network Traffic: You can inspect how many packets are being sent and received, and check which protocols are in use.
– Identifying Listening Ports: Netstat helps identify which ports your system is actively listening on, helping detect unauthorized services or applications.
Netstat Command Options
Here are some of the most frequently used netstat commands and what they do:
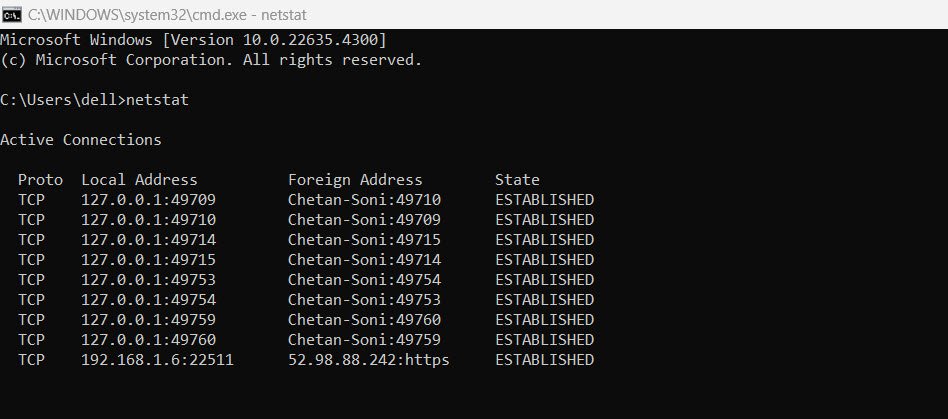
1. netstat
Displays all active TCP connections.
This basic command lists all active connections, including local and foreign addresses, and the state of the connection (e.g., `ESTABLISHED` or `CLOSE_WAIT`).
2. netstat -a
Shows all TCP and UDP connections the system is listening on, as well as all open connections.
Useful for discovering which ports the system is monitoring, both for TCP and UDP. You can quickly identify services running on specific ports (e.g., HTTP on port 80, HTTPS on port 443).
A system listening on `:80` could indicate a web server actively serving HTTP traffic.

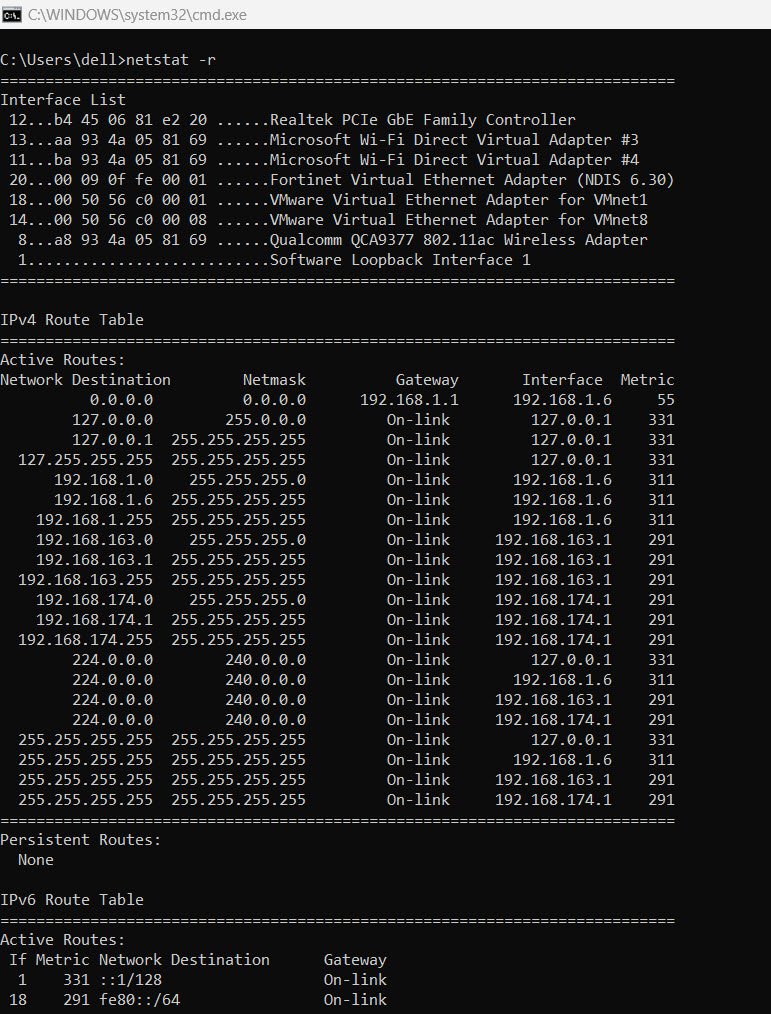
3. netstat -r
Displays the routing table.
Helps administrators view the routes data packets take through the network. This is essential when troubleshooting network path issues or analyzing how data is being routed between network nodes.
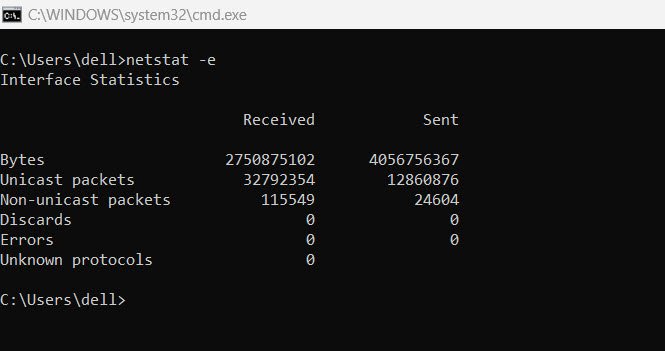
4. netstat -e
Provides statistics on sent and received data packets.
This can be used to gauge network activity, showing how many bytes have been transferred over the network, and is helpful for understanding bandwidth usage.
5. netstat -s
Displays statistics for specific protocols, such as TCP, UDP, ICMP, and IP.
With this command, you can break down statistics per protocol, which is helpful when investigating issues related to specific protocol communications.

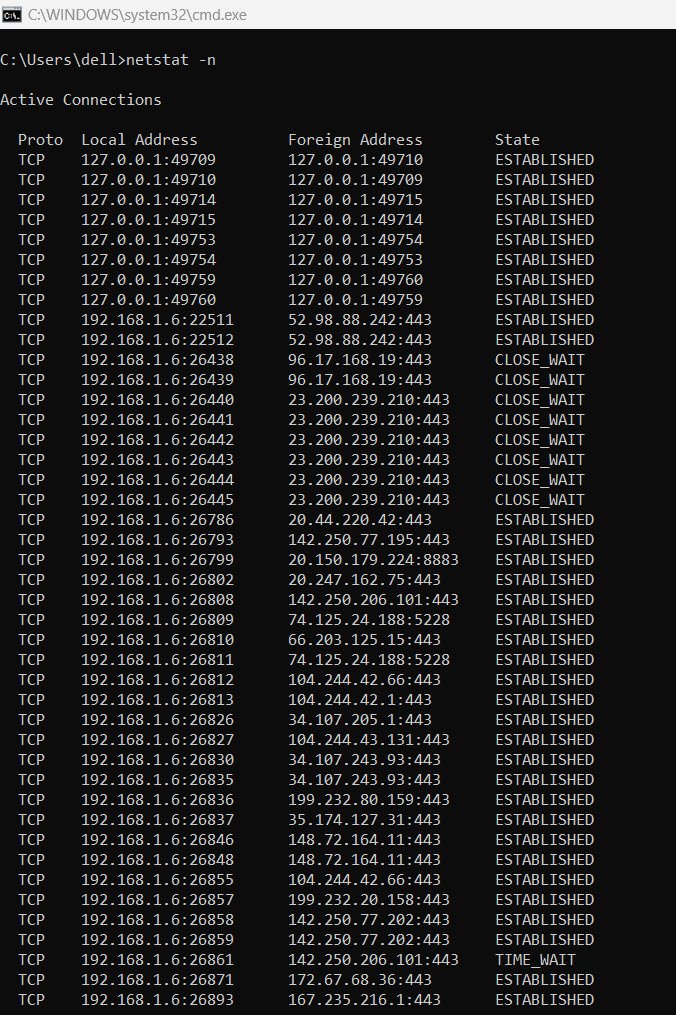
6. netstat -n
Displays connections in numerical form, rather than resolving hostnames.
This is useful for quickly identifying the raw IP address and port numbers in use, saving the need for DNS lookups. It’s helpful when you’re tracking a particular IP or port for suspicious activity.
7. netstat -p [protocol]
Shows statistics for a specific protocol (e.g., TCP, UDP).
If you’re only interested in a particular protocol, such as TCP, this command will filter the output to display only statistics related to that protocol.

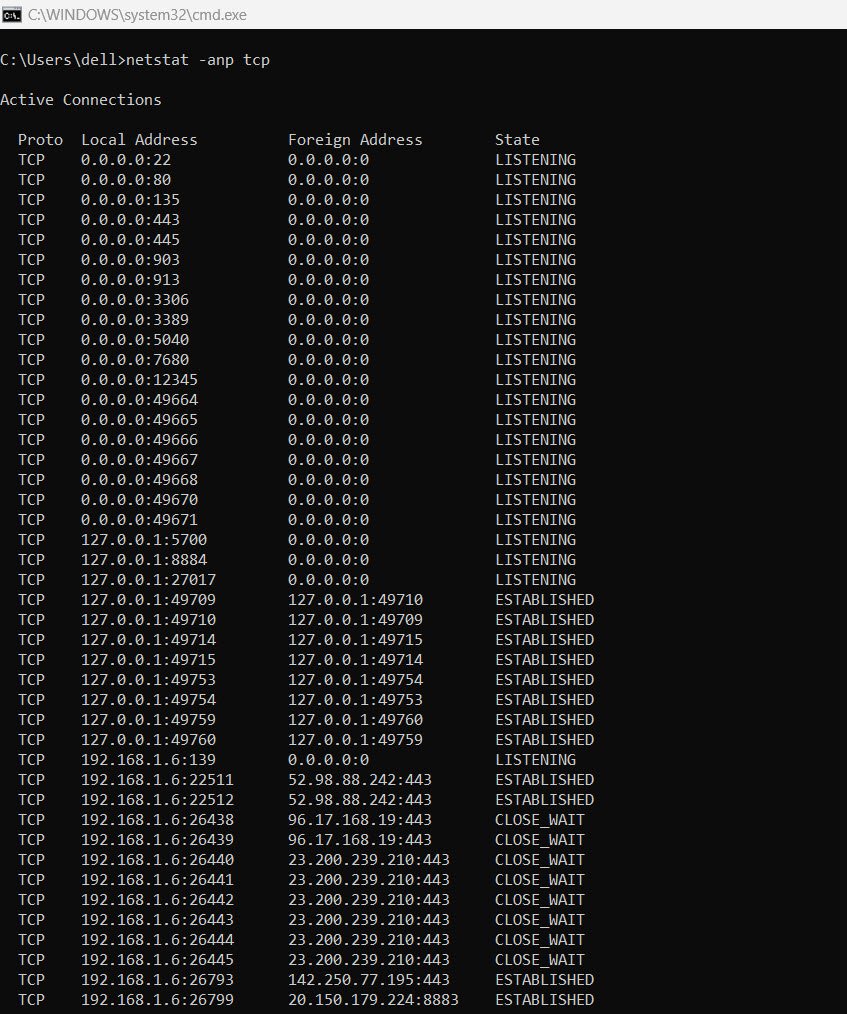
Combining Netstat Options
Netstat commands can be combined to provide more specific results. For instance, you might want to list all listening ports, sorted numerically, for TCP connections only. The command for this would be:
netstat -anp tcpThis command breaks down into:
– `-a`: Display all listening and open connections.
– `-n`: Show addresses and ports in numerical form.
– `-p tcp`: Filter results to only display TCP statistics.
Understanding Connection States
Netstat also shows the state of connections, which is helpful for understanding the lifecycle of a network connection. Some of the most common states are:
| 1. | ESTABLISHED | The normal state for an active data transfer. | This indicates that a connection is actively exchanging data. |
| 2. | LISTEN | Waiting for an incoming connection request. | The system is listening for connections on a specific port, often indicating the presence of a service (e.g., a web server listening on port 80). |
| 3. | CLOSE_WAIT | Waiting for a connection termination request from the local system. | This usually happens when the remote end of the connection has closed, but the local system still needs to finish the termination process. |
| 4. | TIME_WAIT | Waiting for enough time to ensure that the remote system received the acknowledgment of the connection’s termination. | This is a clean-up state where the system is waiting to confirm that no stray packets are in transit before fully closing the connection. |
| 5. | SYN_SENT | The system has sent a SYN (synchronize) packet to establish a new connection. | The local system is waiting for the SYN-ACK response as part of the TCP handshake process. |
| 6. | SYN_RECEIVED | The system has received a SYN packet and sent back a SYN-ACK. | The system is waiting for the final ACK to complete the connection establishment process. If there is an unusually high number of SYN_RECEIVED states, it may indicate a SYN flood attack, where an attacker sends numerous SYN packets but never completes the handshake. |
One of the most important uses of netstat is identifying unauthorized or suspicious connections. For example, if you suspect that a machine in your network has been compromised, netstat can reveal active connections to unfamiliar or potentially malicious IP addresses.
This is especially helpful in detecting backdoors, which are often established via hidden TCP connections. By regularly monitoring your system with netstat, you can quickly spot abnormal network activities and take action to mitigate potential threats.
Conclusion
Netstat is an essential tool for anyone who needs to monitor and troubleshoot network connections. Whether you’re identifying what ports a system is listening on, analyzing packet statistics, or hunting for suspicious connections, netstat provides a wealth of information that can help diagnose and resolve network issues efficiently.
By combining its various options and understanding the meaning of different connection states, you can gain deeper insights into your network’s performance and security.


Pingback: Categorizing IPs with Logstash – Private, Public, and GeoIP Enrichment - Tech Hyme
Pingback: 9 Rules of Engagement for Penetration Testing - Tech Hyme
Pingback: 15 Practical Examples of the ifconfig Command in Linux - Tech Hyme