
In this article, we will learn to configure VMWare ESXI logs to ELK stack using UDP and Syslog protocol. As we all knows, Logstash is configured through a number of plugins that support different output types like stdout, http, tcp, udp and syslog.
We will be using UDP in this example.
Since VMWare’s ESXi runs on Linux kernel, it shares the logging facilities we’re familiar with on Linux systems.
VMware vSphere ESXi 5.0 or higher versions already comes with Syslog service (vmsyslogd) that provides a standard mechanism for logging messages from the VMkernel and other system components.
By default in ESXi 5.0 or higher versions, these logs are placed on a local scratch volume or a ramdisk. To preserve the logs further, ESXi can be configured to place these logs to an alternate storage location on disk and to send the logs across the network to a Syslog server. Earlier versions of vSphere ESXi are configured differently.
ESXi v5.0 or higher generates various types of logs such as:
- /var/log/auth.log
- /var/log/dhclient.log
- /var/log/esxupdate.log
- /var/log/lacp.log
- /var/log/hostd.log
- /var/log/hostd-probe.log
- /var/log/rhttpproxy.log
- /var/log/shell.log
- /var/log/sysboot.log
- /var/log/boot.gz
- /var/log/syslog.log
- /var/log/usb.log
- /var/log/vobd.log
- /var/log/vmkernel.log
- /var/log/vmkwarning.log
- /var/log/vmksummary.log
- /var/log/Xorg.log
For forwarding of logs, you can use vSphere Client, the VMware Host Client, or the esxcli system syslog command to configure the syslog service.
Before to use command line configuration, make sure that your SSH needs to be enabled on the server which can be easily done via vSphere Client.
Now to check the syslog configuration, you can use the following command.
Command: esxcli system syslog config set
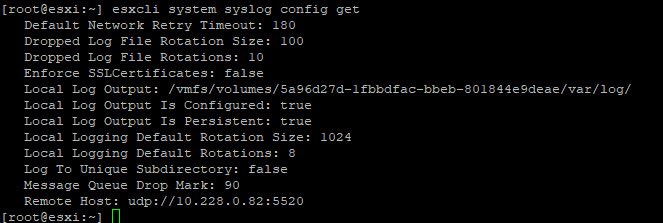
To set the Remote Host, you can run the following command:
Command: esxcli system syslog config set –loghost=’udp://x.x.x.x:5520′
![]()
Where x.x.x.x is the IP address where logstash has been configured and 5520 is the UDP port.
Next you need to reload the syslog server by typing:
Command: esxcli system syslog reload
![]()
In some cases, your firewall will block all the traffic related to TCP/UDP.
To check the firewall configuration, type:
Command: esxcli network firewall get
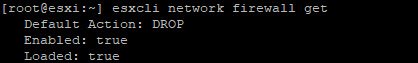
Here you can see that, the firewall is enabled and to disable the firewall, type:
Command: esxcli network firewall set -e=false
![]()
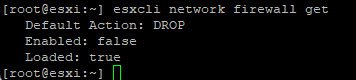
After disabling the firewall, reload the firewall configuration by using the following command:
Command: esxcli network firewall refresh
![]()
To recheck the firewall configuration, type “esxcli network firewall get”
This is all the changes that need to be done on ESXi.
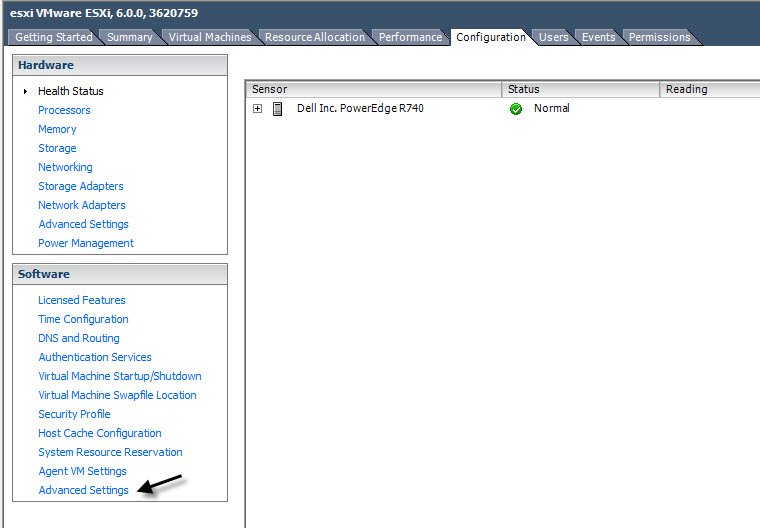
In case, if you want to configure log forwarding using ESXI client, then below are the steps you can follow:
Navigate to Configuration tab and click on “Advanced Settings” as per the following screenshot.
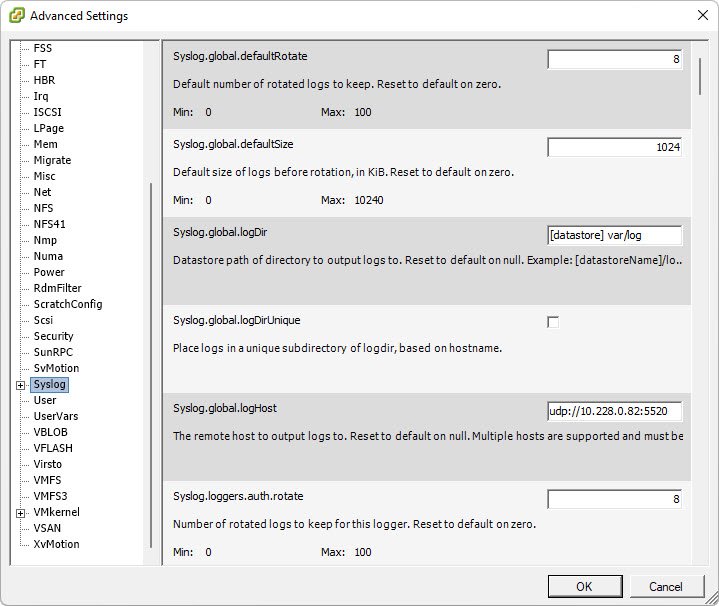
In left sidebar, filter for syslog and setup the following configuration under
“Syslog.global.loghost” = “udp://x.x.x.x:5520”
and
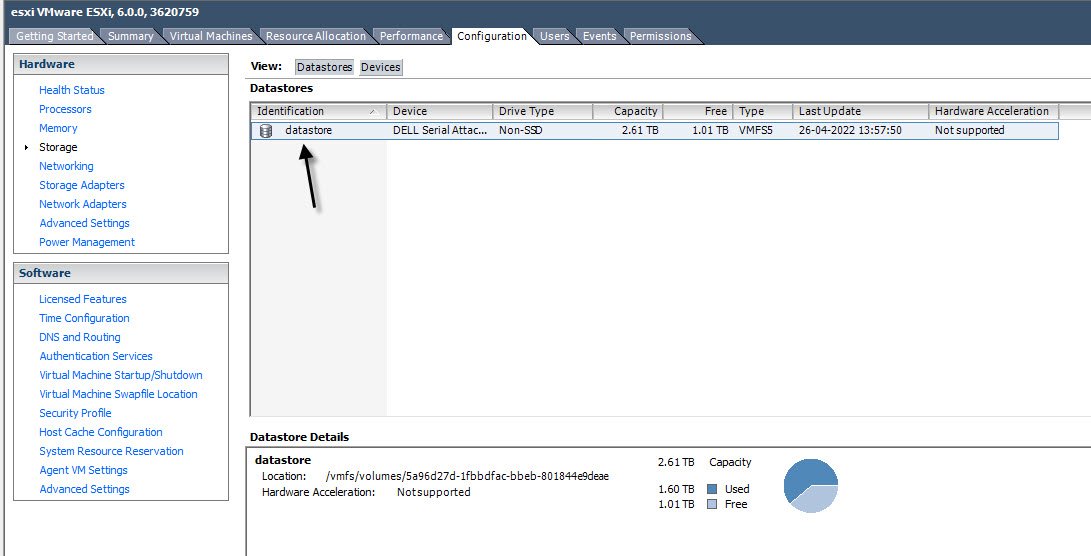
“Syslog.global.logDir” = “[datastore var/log]”
To find the Syslog.global.logDir location, you can refer the following screenshot.
It has the format [DatastoreName] DirectoryName.
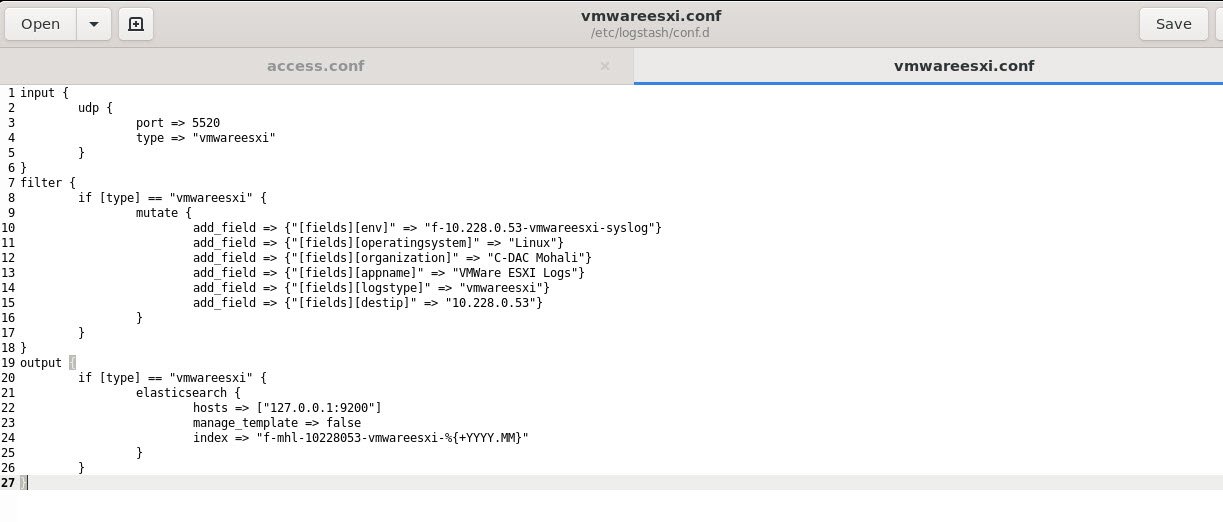
On Logstash conf file, just add an input of type UDP matching the port defined in host (5520 in our case).
input{
udp{
port=> 5520
type=>”vmwareesxi”
}
}
Don’t forget to add filter and output section in logstash config file as per your settings.
Restart Logstash and let it warm up. If everything went well, we should see events trickling into Elasticsearch.
Now that we have collected some logs, let’s check it via Elastichead Chrome Addon to make sure they’ve been properly received.
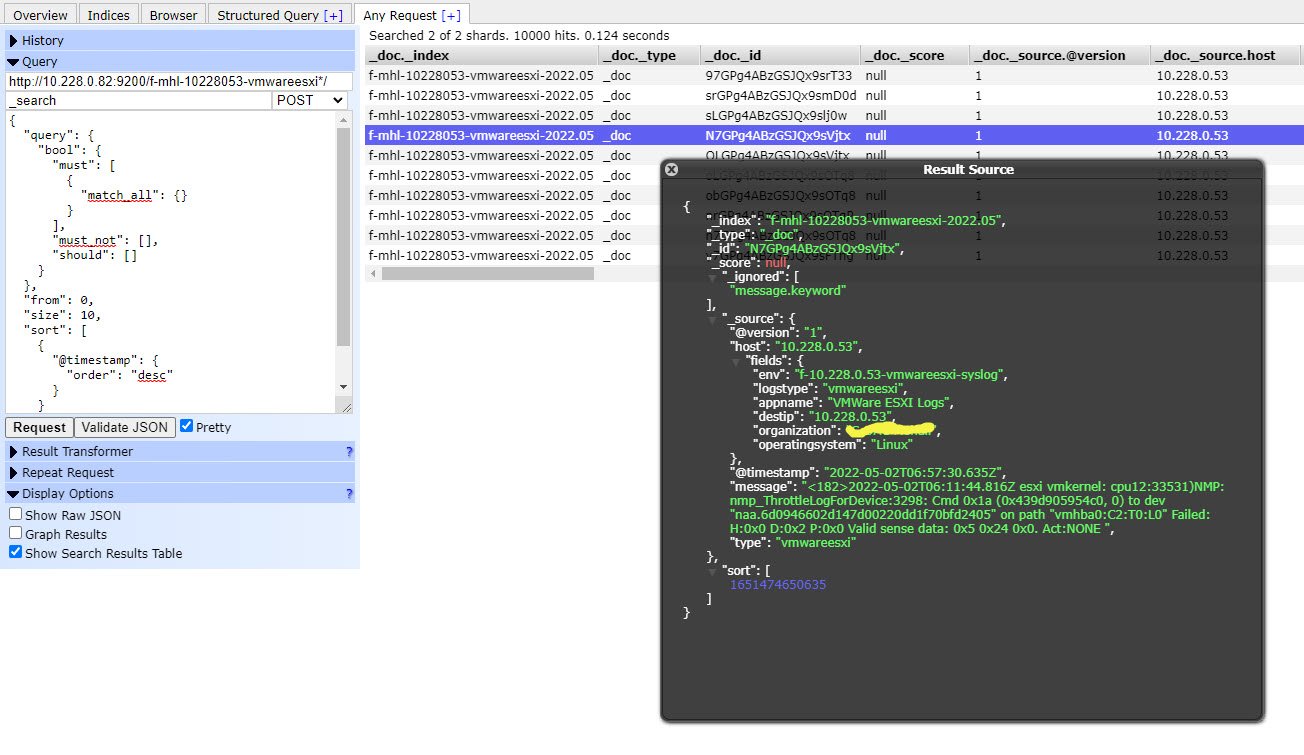
You can also use Kibana to see the logs.


Pingback: Sending Windows Logs to Syslog Server using NXLog-CE - Tech Hyme