
When it comes to diagnosing and troubleshooting issues in Windows, having the right tools at your disposal is crucial. WinDbg, short for Windows Debugger, is a powerful tool provided by Microsoft for analyzing and debugging Windows system problems. Whether you’re a developer, system administrator, or a curious Windows enthusiast, WinDbg can be a valuable addition to your toolkit.
In this article, we will walk you through the steps to install WinDbg on your Windows system.
What Is WinDbg?
WinDbg is a professional-grade debugging tool designed primarily for developers, system administrators, and support professionals. It can help identify and analyze issues such as application crashes, blue screen errors (BSODs), and kernel-level problems. WinDbg is often used to analyze crash dumps, both from user-mode and kernel-mode components of Windows.
Here’s how you can install WinDbg on your Windows system:
Step 1: Download the Windows Software Development Kit (SDK)
Before you can install WinDbg, you need to download and install the Windows Software Development Kit (SDK). WinDbg is included as part of the SDK package.
Step 2: Install the Windows SDK
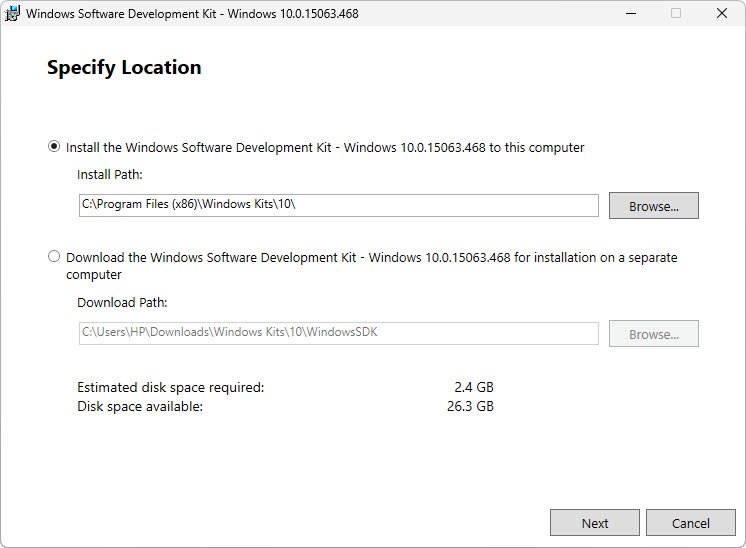
Once the download is complete, locate the downloaded file (usually named something like “winsdksetup.exe“) and double-click it to start the installation process.
You should see something like the following. Click Next to continue.
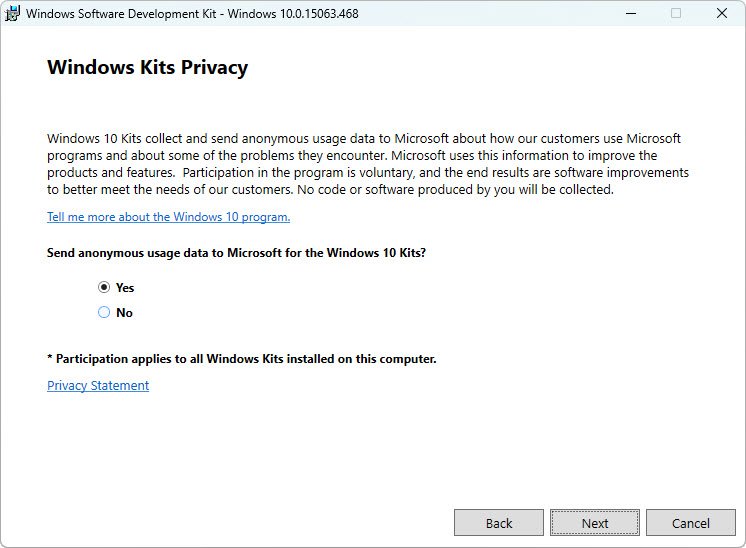
Here, you may select Yes or No, and then click Next to continue.
You may click Accept to continue.

This screen is the most important of all. Here, you need to only select one option, which is the Debugging Tools for Windows.
No other boxes should be checked.

Click Close on the last screen to complete the installation.

Step 3: Access WinDbg
Once the installation is complete, you can access WinDbg through the Windows Start menu. Simply type “WinDbg” into the search bar, and it should appear as one of the search results.
Click on the WinDbg icon to launch the tool.

Using WinDbg
WinDbg is a robust tool with many features and capabilities. It allows you to open crash dump files, attach to running processes, and perform in-depth debugging and analysis. To start using WinDbg effectively, you’ll need some knowledge of debugging techniques and the ability to read and understand the results it provides.
Here are some key tasks you can perform with WinDbg:
- Loading Crash Dumps: You can open crash dump files to analyze the cause of system crashes or application errors.
- Symbol Configuration: Configure symbol paths to help WinDbg resolve memory addresses to meaningful function and variable names.
- Debugging Sessions: Attach WinDbg to running processes to diagnose issues in real-time.
- Running Commands: You can enter commands and scripts to perform various debugging tasks.
- Scripting: WinDbg allows you to automate tasks using scripting languages like JavaScript.
Conclusion
WinDbg is a versatile and powerful tool for analyzing and debugging Windows system issues. Installing it as part of the Windows SDK is a straightforward process, and once you have it on your system, it becomes an invaluable resource for diagnosing and solving problems.
Whether you are a developer looking to squash bugs in your applications or a system administrator investigating system crashes, WinDbg is an essential addition to your toolkit. It might take some time to become proficient with WinDbg, but the effort is well worth it when it comes to resolving complex issues on your Windows system.
You may also like:- How To Install Python 2.7.18 From The Source
- How To Parse SSH Authentication Logs with Logstash
- How To Easily Crack Wi-Fi Password
- 6 Most Useful Windows Command Prompt Commands
- Ripgrep – Searching for Specific File Types and Beyond
- Insert and Create Data in Elasticsearch
- Manage Time and Date in Linux with timedatectl
- How to Set Network Adapter Priority on Windows 11
- How to Add a User to Sudoers on Ubuntu
- 25 Popular Linux IP Command Examples