The Central Processing Unit (CPU) is the brain of a computer, responsible for executing instructions and performing tasks. Monitoring the CPU load percentage is essential for assessing system performance and identifying potential bottlenecks.
Fortunately, Windows provides a straightforward method to check the CPU load percentage using the Command Prompt.
Using WMIC (Windows Management Instrumentation Command-line)
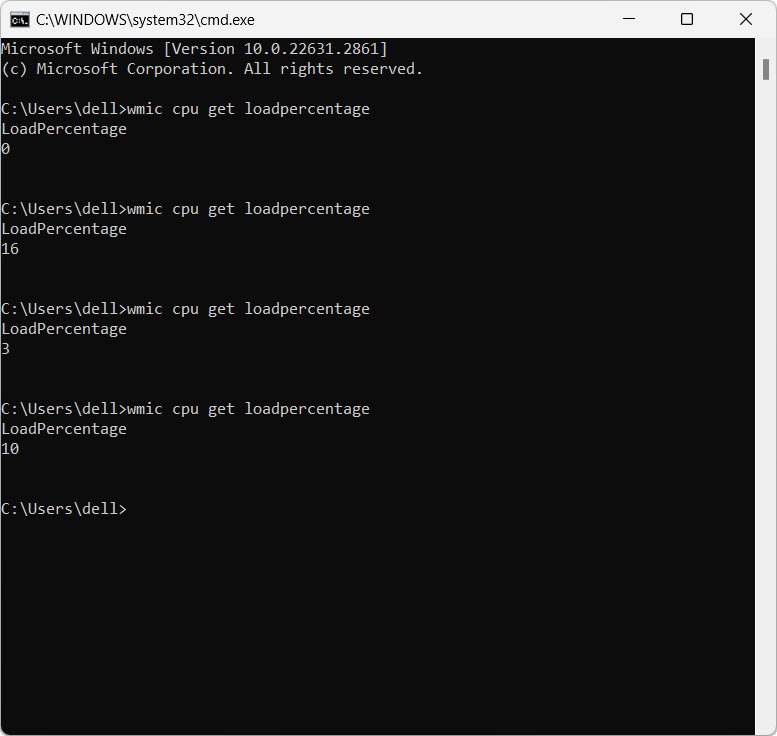
Windows Management Instrumentation (WMI) allows you to access system resources, and the `wmic` command-line tool provides a convenient way to interact with WMI. To check the CPU load percentage, follow these simple steps:
Step 1: Open Command Prompt
Press `Win + R` to open the Run dialog, type “cmd,” and press Enter. Alternatively, you can search for “Command Prompt” in the Start menu.
Step 2: Enter WMIC Command
In the Command Prompt window, type the following command and press Enter:
wmic cpu get loadpercentageStep 3: Interpret the Results
After executing the command, you will see a numerical value representing the CPU load percentage. This value reflects the current utilization of the CPU.

Understanding CPU Load Percentage:
- 0% – 100%
- A load percentage close to 0% indicates minimal CPU usage.
- A load percentage close to 100% suggests the CPU is heavily utilized.
- Monitoring Over Time
- Running the command multiple times over a period allows you to observe fluctuations in CPU usage.
- Consistently high percentages may indicate resource-intensive processes or applications.
Tips and Considerations
- Task Manager Comparison – Cross-verify the results with the Task Manager for a comprehensive view of system resource usage.
- Identifying Culprits – High CPU load may be caused by specific processes. Investigate further using tools like Task Manager or additional command-line utilities.
- Automating Monitoring – Incorporate the `wmic` command into scripts or monitoring tools for automated tracking of CPU load.
Conclusion
Checking the CPU load percentage using the Command Prompt provides a quick and efficient way to assess the system’s current state. Whether you are troubleshooting performance issues or simply monitoring resource utilization, this method offers valuable insights into your computer’s CPU usage.
Remember to interpret the results in the context of your system’s overall performance and address any anomalies accordingly.
You may also like:- How To Install Python 2.7.18 From The Source
- How To Parse SSH Authentication Logs with Logstash
- How To Easily Crack Wi-Fi Password
- 6 Most Useful Windows Command Prompt Commands
- Ripgrep – Searching for Specific File Types and Beyond
- Insert and Create Data in Elasticsearch
- Manage Time and Date in Linux with timedatectl
- How to Set Network Adapter Priority on Windows 11
- How to Add a User to Sudoers on Ubuntu
- 25 Popular Linux IP Command Examples


