
The Elastic Stack, formerly known as the ELK Stack is a collection of open-source software produced by Elastic which allows you to search, analyze, and visualize logs generated from various sources in any format.
Logging & monitoring can be very useful when attempting to identify problems with your servers or applications, as it allows you to search through all of your logs in a single place and further correlating their logs during a specific time frame.
The Elastic Stack has mainly four components:
- Elasticsearch – a RESTful search engine for storing the logs
- Logstash – a data processing component
- Kibana – a web interface to visualize all logs
- Beats – a lightweight shipper that can send logs to either Logstash or Elasticsearch (filebeat, winlogbeat, auditbeat, metricbeat, packetbeat, heartbeat, functionbeat)
Prerequisites
You will need the following:
- An Ubuntu 21.04 server including a root user.
- An IIS web server machine for collecting the access logs
The Elastic Stack components are not available in Ubuntu’s default package repositories. They can, however, be installed with APT after adding Elastic’s package source list.
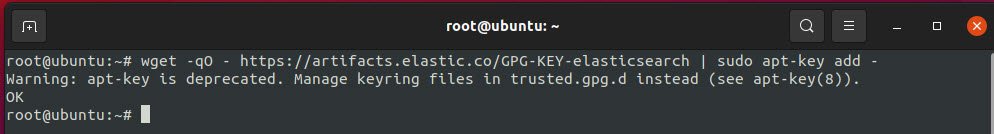
To import the Elasticsearch public GPG key into APT, type the following command:
Command: wget -qO – https://artifacts.elastic.co/GPG-KEY-elasticsearch | sudo apt-key add –
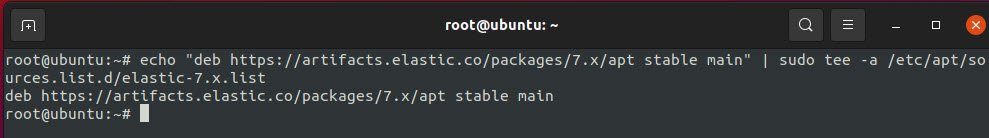
Next, you need to add the Elastic source list to the sources.list.d directory, type the following command to do this:
Command: echo “deb https://artifacts.elastic.co/packages/7.x/apt stable main” | sudo tee -a /etc/apt/sources.list.d/elastic-7.x.list
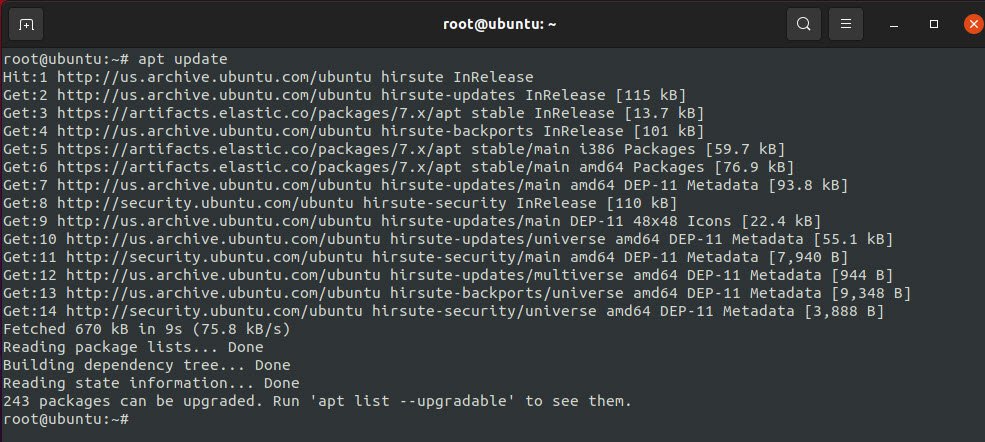
After this, type “sudo apt update” command to update your package lists so that APT will read the new Elastic repository.
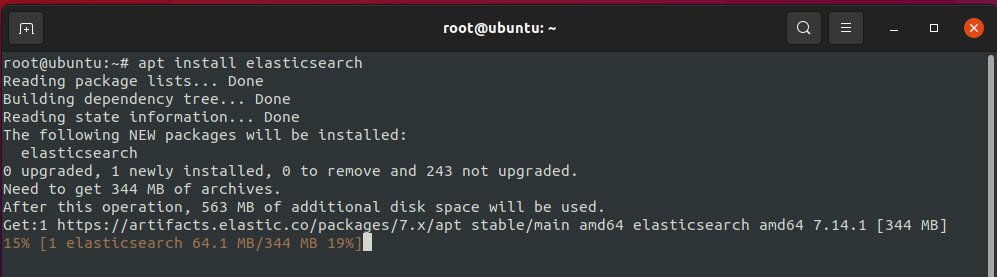
1) Installation of Elasticsearch –
Start the installation of elasticsearch by typing the following command:
Command: apt install elasticsearch
Once it is finished with installation, use your preferred text editor (gedit in our case) to edit Elasticsearch’s main configuration file located at /etc/elasticsearch/elasticsearch.yml.
Elasticsearch listens for traffic from everywhere on port 9200. You will want to restrict outside access to your Elasticsearch instance to prevent outsiders from reading your data or shutting down your Elasticsearch cluster through the REST API.
Find the line that specifies network.host & http.port, uncomment it, and replace its value with localhost & 9200 respectively so it looks like this:
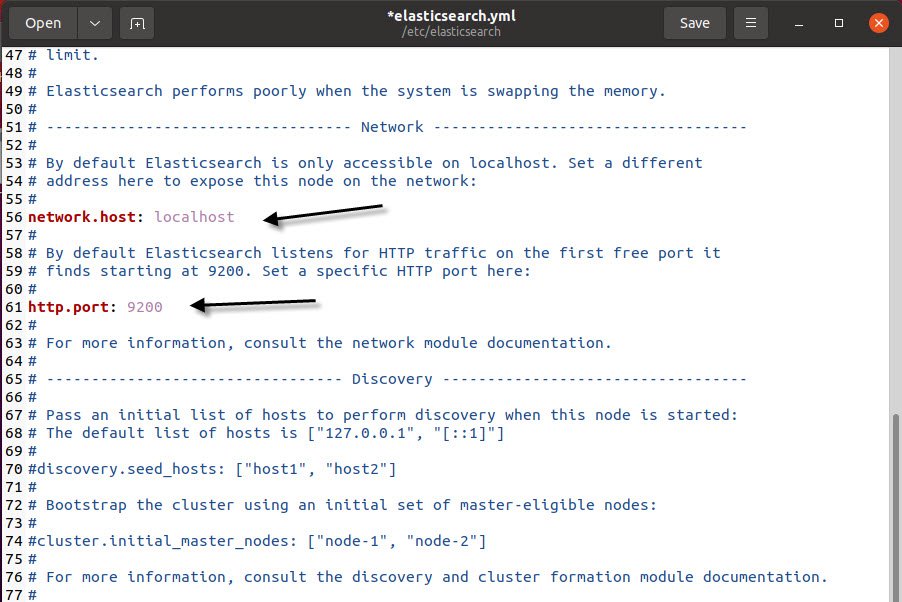
In case, if you do not want to restrict this, then you can use network.host: 0.0.0.0 value to access the elasticsearch service through outside.
Save and close elasticsearch.yml by pressing save button or CTRL + s. Then, start the Elasticsearch service with systemctl:
Command: systemctl start elasticsearch

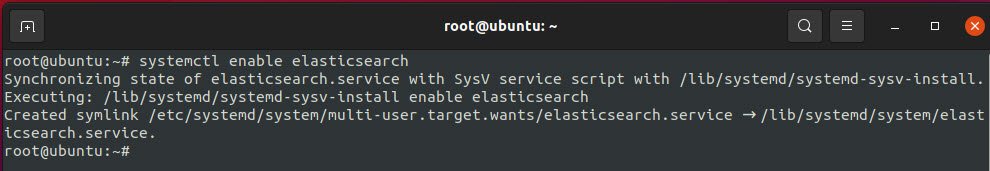
You also need to run the following command to enable Elasticsearch to start up every time your server boots.
Command: systemctl enable systemctl
Next step is to test whether your Elasticsearch service is running by sending an HTTP request by typing:
Command: curl -X GET “localhost:9200”

You will see a response showing some basic information about your local node & cluster, similar to above screenshot.
2) Installation of Logstash –
Let’s install logstash, the next component of the Elastic Stack. Although it is also possible for all beats such as filebeat, packetbeat etc to send data directly to the Elasticsearch database, but we recommend to use Logstash to process the data.
This will allow you to collect data from different sources, transform it into a common format, and export it to another database.
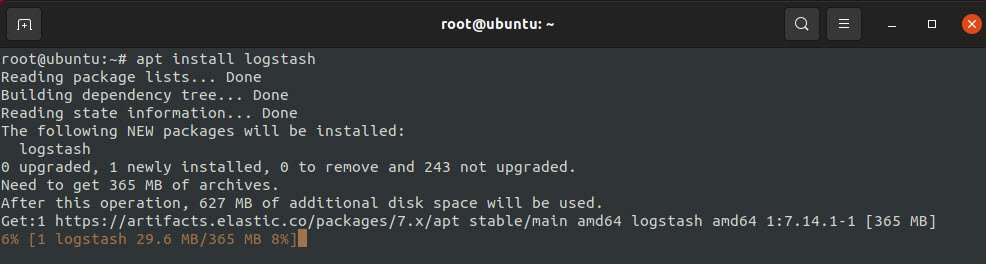
To install this, type the following command:
Command: apt install logstash
After installing Logstash, you can move on to configuring it.
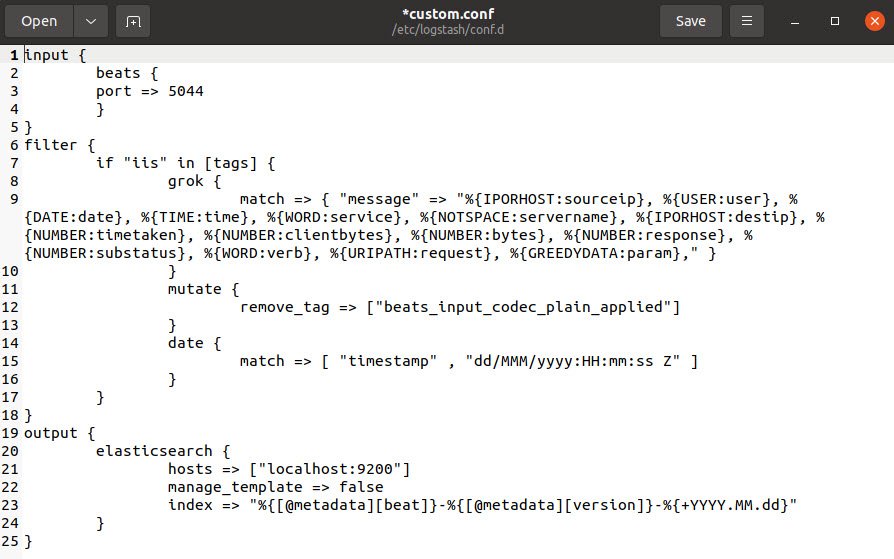
Logstash’s configuration files are written in the JSON format and reside in the /etc/logstash/conf.d directory.
Create a configuration file called /etc/logstash/conf.d/custom.conf where you will set up your input, filter and output settings. There are 3 major components of logstash i.e. INPUT, FILTER and OUTPUT.
- Input specified the beats input that will listen on TCP port 5044.
- Filter component is used to parse incoming logs to make them structured and usable by Kibana Dashboard.
- Output configures logstash to store the beats data in elasticsearch running at localhost:9200 in an INDEX.
The Beat used in this tutorial is Filebeat which is installed on an IIS web server.
Next step is to test your Logstash configuration with the following command:
Command: sudo -u logstash /usr/share/logstash/bin/logstash –path.settings /etc/logstash -t
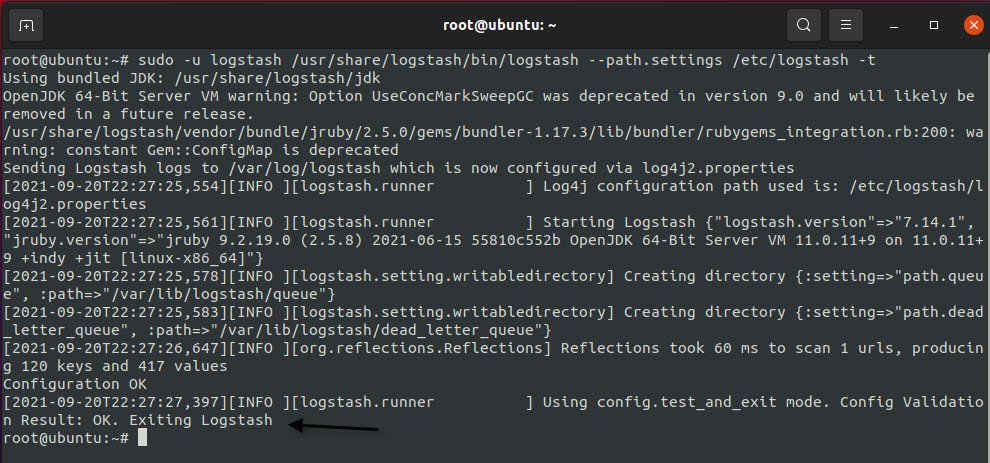
If there are no syntax errors, your output will display Configuration OK after a few seconds. If you don’t see this in your output, check for any errors that appear in your output and update your configuration to correct them (/var/logs/logstash/…).
If your configuration test is successful, start and enable Logstash to put the configuration changes into effect by typing:
Command: sudo systemctl start logstash
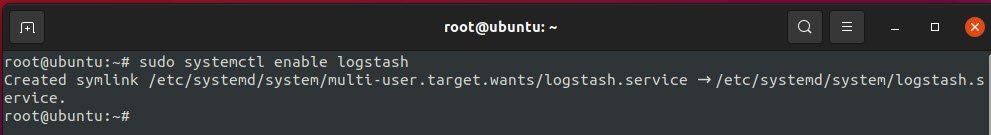
Command: sudo systemctl enable logstash
3) Installation of Kibana –
The last step is to install the Kibana to visualize the logs. To install Kibana, type:
Command: apt install kibana

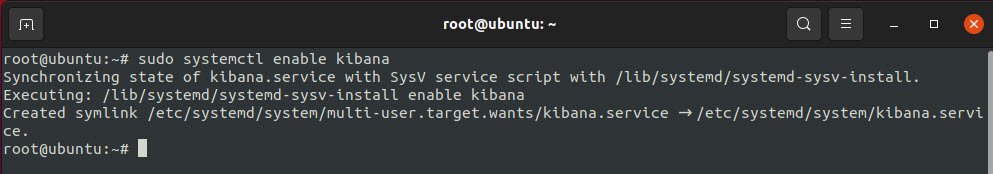
To start and enable the Kibana service, type the following commands:
Command: sudo systemctl enable kibana
Command: sudo systemctl start kibana

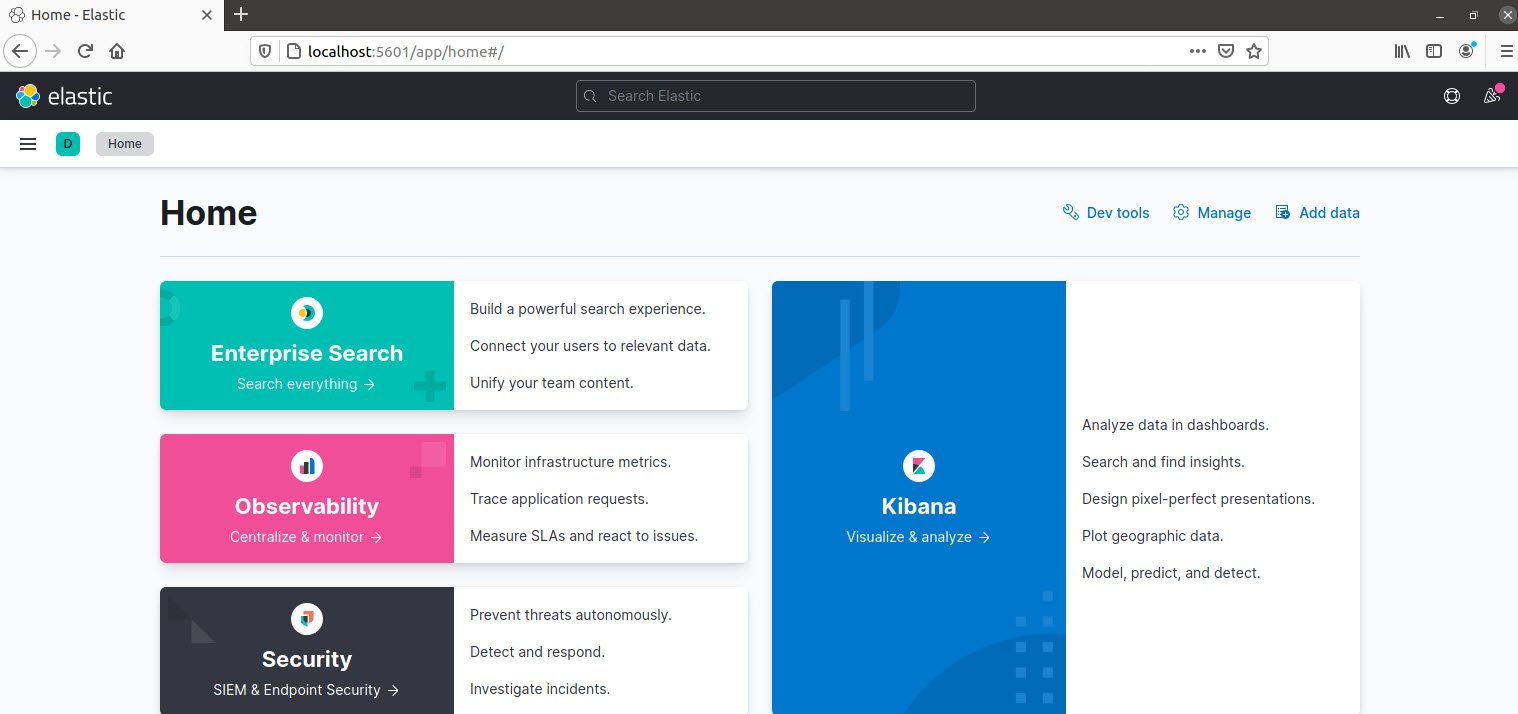
As Kibana is configured to only listen on localhost, you can check the Kibana server’s status page by navigating to the following address and entering your login credentials if prompted: localhost:5601. To access from external source, you should setup reverse proxy.
Now that the Kibana dashboard is configured, let’s install the beat of your choice.
You may also like:- How To Install Python 2.7.18 From The Source
- How To Parse SSH Authentication Logs with Logstash
- How To Easily Crack Wi-Fi Password
- 6 Most Useful Windows Command Prompt Commands
- Ripgrep – Searching for Specific File Types and Beyond
- Insert and Create Data in Elasticsearch
- Manage Time and Date in Linux with timedatectl
- How to Set Network Adapter Priority on Windows 11
- How to Add a User to Sudoers on Ubuntu
- 25 Popular Linux IP Command Examples


This Post Has One Comment